
Spatial Insights into CSO Income Profile
- September 3, 2019

On June 20th 2019, the Central Statistics Office released the most detailed profile yet on Ireland’s income distribution. What is especially interesting is that this is a geographical profile, paying particular attention to the spatial variation in wealth and income.
We are particularly interested in the distribution of household income. The data provided with this release includes the median income of each of the 3,409 Electoral Divisions (EDs) in the country. This is fascinating because it allows us to dig deeper than county level and use other data sources to gain deeper insights.
Big Discrepancies at Small Distances
The Electoral Division with the lowest median income is Custom House B in Waterford. Half of the 122 households in this ED have annual income less than €14,901. Looking at the Census 2016 data for this Electoral Division gives us more insights into what is behind this. Of the 246 people aged 15+ in this ED, 32% reported their principle economic status as “unemployed”, four times higher than the national rate of 8%. Of those who have finished their education, only 39% have a qualification beyond Leaving Certificate level, compared with the national average of 48%.
Just five kilometres away as the crow flies is Kilbarry (Part Rural), the Electoral Division with the second-highest median income in the country. Half of the 75 households here have income greater than €101,740 – more than six times higher! Based on the 2016 Census of Population, the unemployment rate here is also much lower at only 3%, and 70% have an educational qualification beyond Leaving Certificate level.
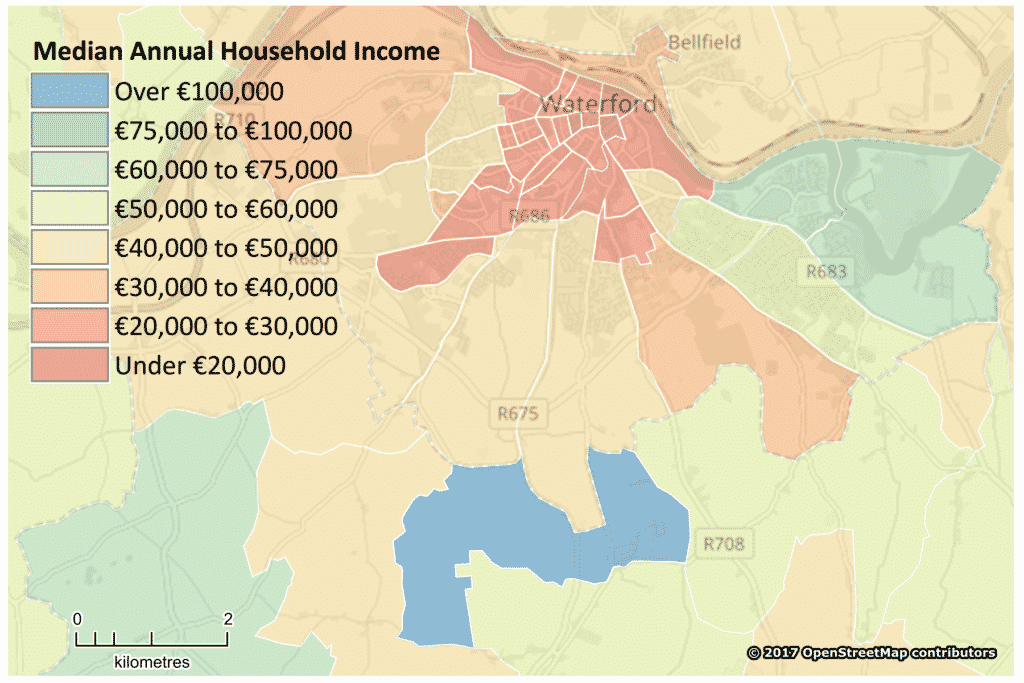
Of course, we only selected these two Electoral Divisions to compare because they are geographically close yet economically very different. The same analysis could be carried out for any location.
Income and Deprivation Score
As well as variation between Electoral Divisions, we are also interested in the variation within them. Electoral Divisions are subdivided into Small Areas, with between one and 123 Small Areas per Electoral Division. Small Areas are the most detailed geographic unit available, and unlike Electoral Divisions they are all about the same size, roughly 100 households. Being small and consistent in size makes them a perfect spatial unit for analysis and models, so we are very interested in whether all the small areas within each Electoral Division can be taken to have the same income.
Another source of insight on the socioeconomic status of small areas is the Haase-Pratschke Index of Multiple Deprivation. This index scores each small area in the country on a scale from Very Deprived to Very Affluent. The Index uses multiple variables, none of which is directly equivalent to income. However, taken together, we can use the Index as a guide to how much variation in income might exist between Small Areas within the same Electoral Division.
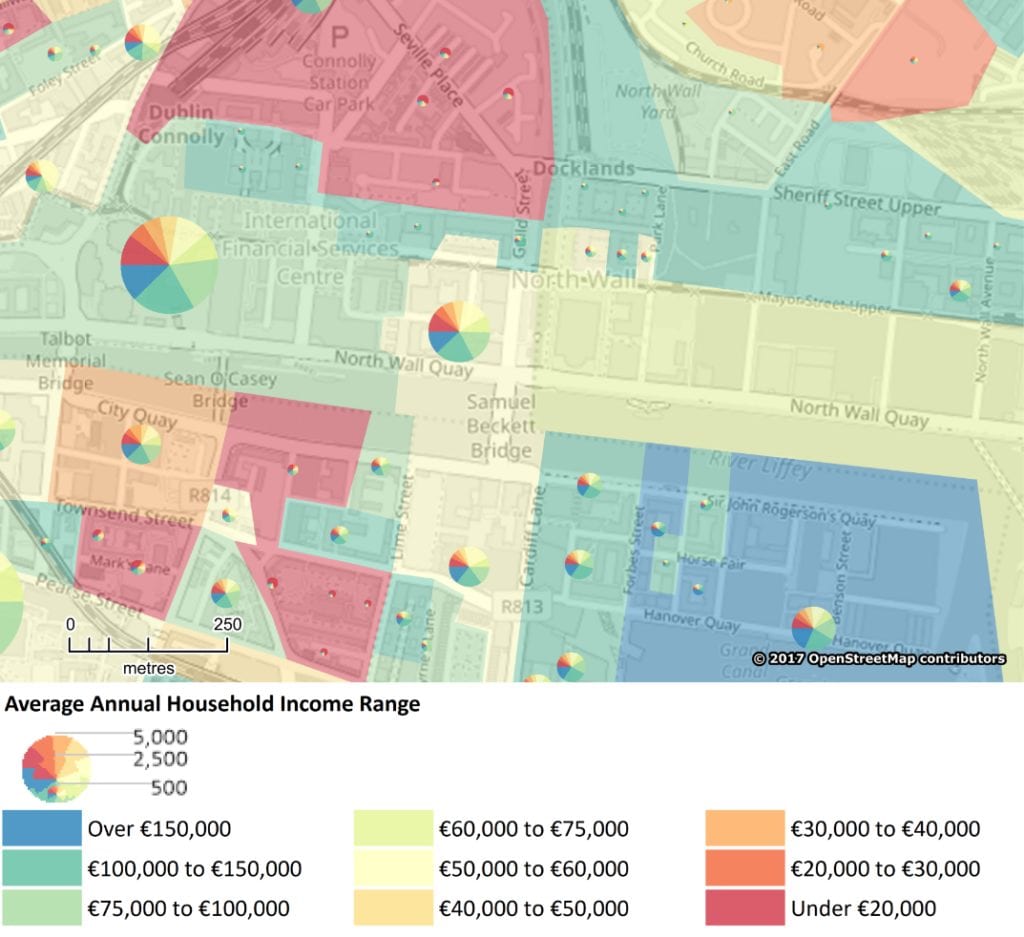
One Electoral Division with very wide variation in deprivation score is Docklands C in Dublin. The small areas here range from very deprived to very affluent.
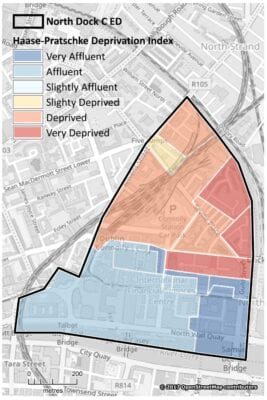
The median household income for this Electoral Division is €48,549, which is close to the national median of €45,256. However, it would not be realistic to model the same income range for each of these very different Small Areas within the Electoral Division. Instead, we increase the income in highly affluent Small Areas and decrease the income in highly deprived ones, so that we have a household income figure for each Small Area in the country.
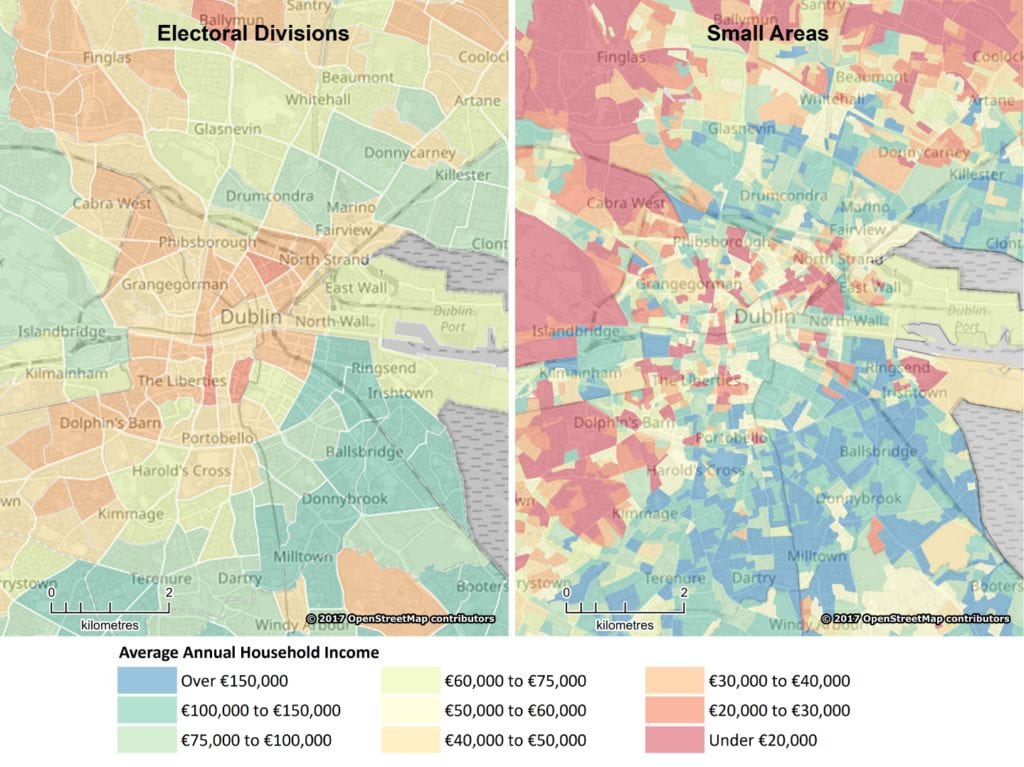
Small Areas give us a much richer, more detailed picture of the variation in household income.
From Residents to Workday Population
For many applications, knowing the income profile of the population resident in a certain area is exactly what is needed. For example, a direct marketing campaign can be made much more effective by targeting only addresses in areas with a particular income profile. In some other situations, the local residents’ income may be of less relevance than the income of the daytime population. For example, a retailer of luxury take-away tea and coffee might be more interested in areas where affluent people work than where they live.
We have figures for the number of people who live in each small area, either commuting outwards to work or study or remaining at home during the day. We also have figures for the number of people who commute into each Small Area to work or study. There is one more dataset published by the Central Statistics Office which unites these two – the Electoral Division to Electoral Division Commuter Flow Dataset. For each origin-destination pair, this gives the number of people who live in the origin ED and work or study in the destination ED. We can use this to develop a model for the home Small Areas of the daytime population of each Small Area. This allows us to visualise the income profile of the daytime population of each Small Area and compare it with the residential population.
Conclusion
Accurate profiles of income range at very small geographies are useful for so many aspects of decision-making, from targeting a direct-mailing campaign at the households most likely to respond, to expanding a store network into the affluent and under-served market gaps. This new release allows us to further refine our existing income model.
@ 2019 Gamma.ie by Charlotte Cuffe
About Gamma
Gamma is a solutions provider that integrates software, data and services to help our clients realise greater benefits from location-based information. With Gamma’s Geo-Marketing service, you can create a highly specific, targeted direct marketing campaign, based on accurate customer data and analysis to give above-average results at lower costs. You don’t need to waste money sending coupon offers to everyone near your store or in your loyalty database as it often wastes money and leads to little long-term return on investment. Gamma’s strategy is proven to increase campaign performance and maximise the chance of better redemption rates.