Some of the key findings from the survey are:
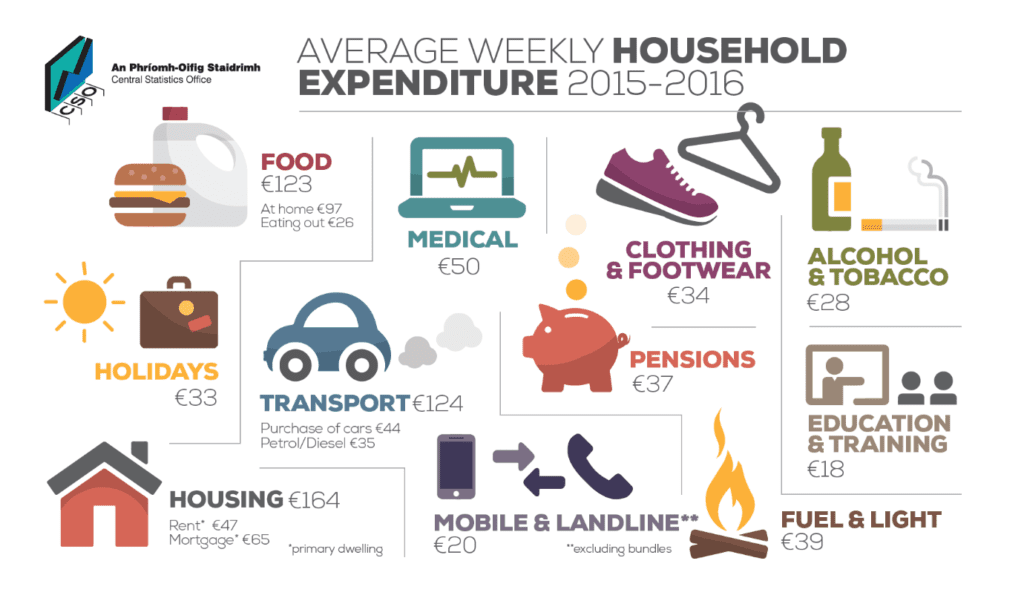
1. Household expenditure on Alcoholic Drink and Tobacco fell by almost 30% in the six year period since the previous HBS. Almost all of this reduction was on Alcoholic Drink and Tobacco consumed away from home.
2. The number of households with a fixed telephone line decreased from just under 86% ten years ago to 66% in 2015/2016. In the same period, home computer ownership increased from 56% to over 80% and 38% of households now have a games console, up from 29% in 2004/2005.
3. Household expenditure on Food has been falling since 1980. This trend continued in 2015/2016, and food now accounts for 14.6% of household expenditure.
4. Households in Dublin spent over a quarter of their food expenditure out of the home, by contrast in the West this figure was 17%.
5. Households in very disadvantaged areas devoted 17% of their total expenditure to food, and 18% to housing. At the other end of the scale, in the most affluent areas food expenditure was under 13% of their total, while housing accounted for 23.5%.
6. The Mid-East region has the highest weekly expenditure on transport at €157, households in Dublin spend €106 which is the least.
7. Total Household Expenditure grew by 4.3% since 2009/2010 and now averages at €845.12. CPI over that timeframe was 6.3%, meaning that there was a real decrease of 2% in the volume of household expenditure. Average gross incomes grew by 6.8% in the period, however, disposable incomes increased by only 2.7%, reflecting increases in taxation.
We will be busy analysing the full detail of the HBS for the next number of weeks, and we will be updating our models and systems with new insight from the date in the coming weeks and months. We will also be blogging further about the HBS in the coming days.